


Energy prices may vary depending on the tariff period. For this reason, analysing how electricity consumption is distributed throughout the day provides a better understanding of its economic impact and helps identify potential opportunities for optimisation.
It is not just about consuming less, but about having enough information to understand when we consume energy, what is driving that consumption and how much it costs us.

Tariff periods are the different time slots into which the day is divided, each with different economic conditions for energy consumption.
This means that two installations with similar annual consumption may end up with different costs, depending on how they distribute their consumption across the different periods.
Therefore, analysing consumption by tariff period makes it possible to see what proportion of energy is consumed in each time slot and how this affects the installation’s energy costs.
When operational requirements allow, some processes or loads can be shifted to periods with lower costs. In other cases, even when operating schedules cannot be changed, this information helps clarify which activities are having the greatest economic impact.
Analysing total consumption alone provides only a partial picture of an installation’s performance.
Knowing how electricity consumption is distributed across time slots helps answer questions such as:
Answering these questions makes it possible to move beyond simply knowing how much energy you consume and understand when you consume it and how it affects costs.
This information is particularly useful as part of an energy management strategy, as it helps identify patterns and make decisions based on the installation’s actual performance.

Consumption distribution can vary considerably depending on the type of activity.
In an industrial installation, for example, certain production processes may be concentrated in specific hours of the day. Analysing how these processes coincide with the different tariff periods provides a better understanding of their impact on energy costs.
In a building in the building sector, however, air conditioning, lighting, ventilation systems or other services may account for a significant share of consumption during certain time slots.
In both cases, having detailed information on electricity consumption by time slot makes it possible to identify which times of day have the greatest energy and economic impact.
Identifying which period accounts for the highest consumption or cost is only the first step.
To implement improvement measures, it is also necessary to know what is driving that consumption.
Linking tariff periods to other installation data makes it possible to identify whether increases in consumption coincide, for example, with:
Once the periods with the highest consumption or cost have been identified, different optimisation measures can be assessed.
Depending on the activity and the needs of each installation, some loads can be shifted to other time slots, certain operating schedules can be modified, or processes generating high consumption can be reviewed.
However, not all consumption can be shifted.
For this reason, before making decisions, it is important to have data that makes it possible to distinguish which consumption is part of normal operations and which offers scope for improvement.
Energy monitoring facilitates this analysis by providing a more detailed view of how consumption evolves and helping to detect patterns, deviations or behaviours that might go unnoticed when reviewing only the electricity bill.
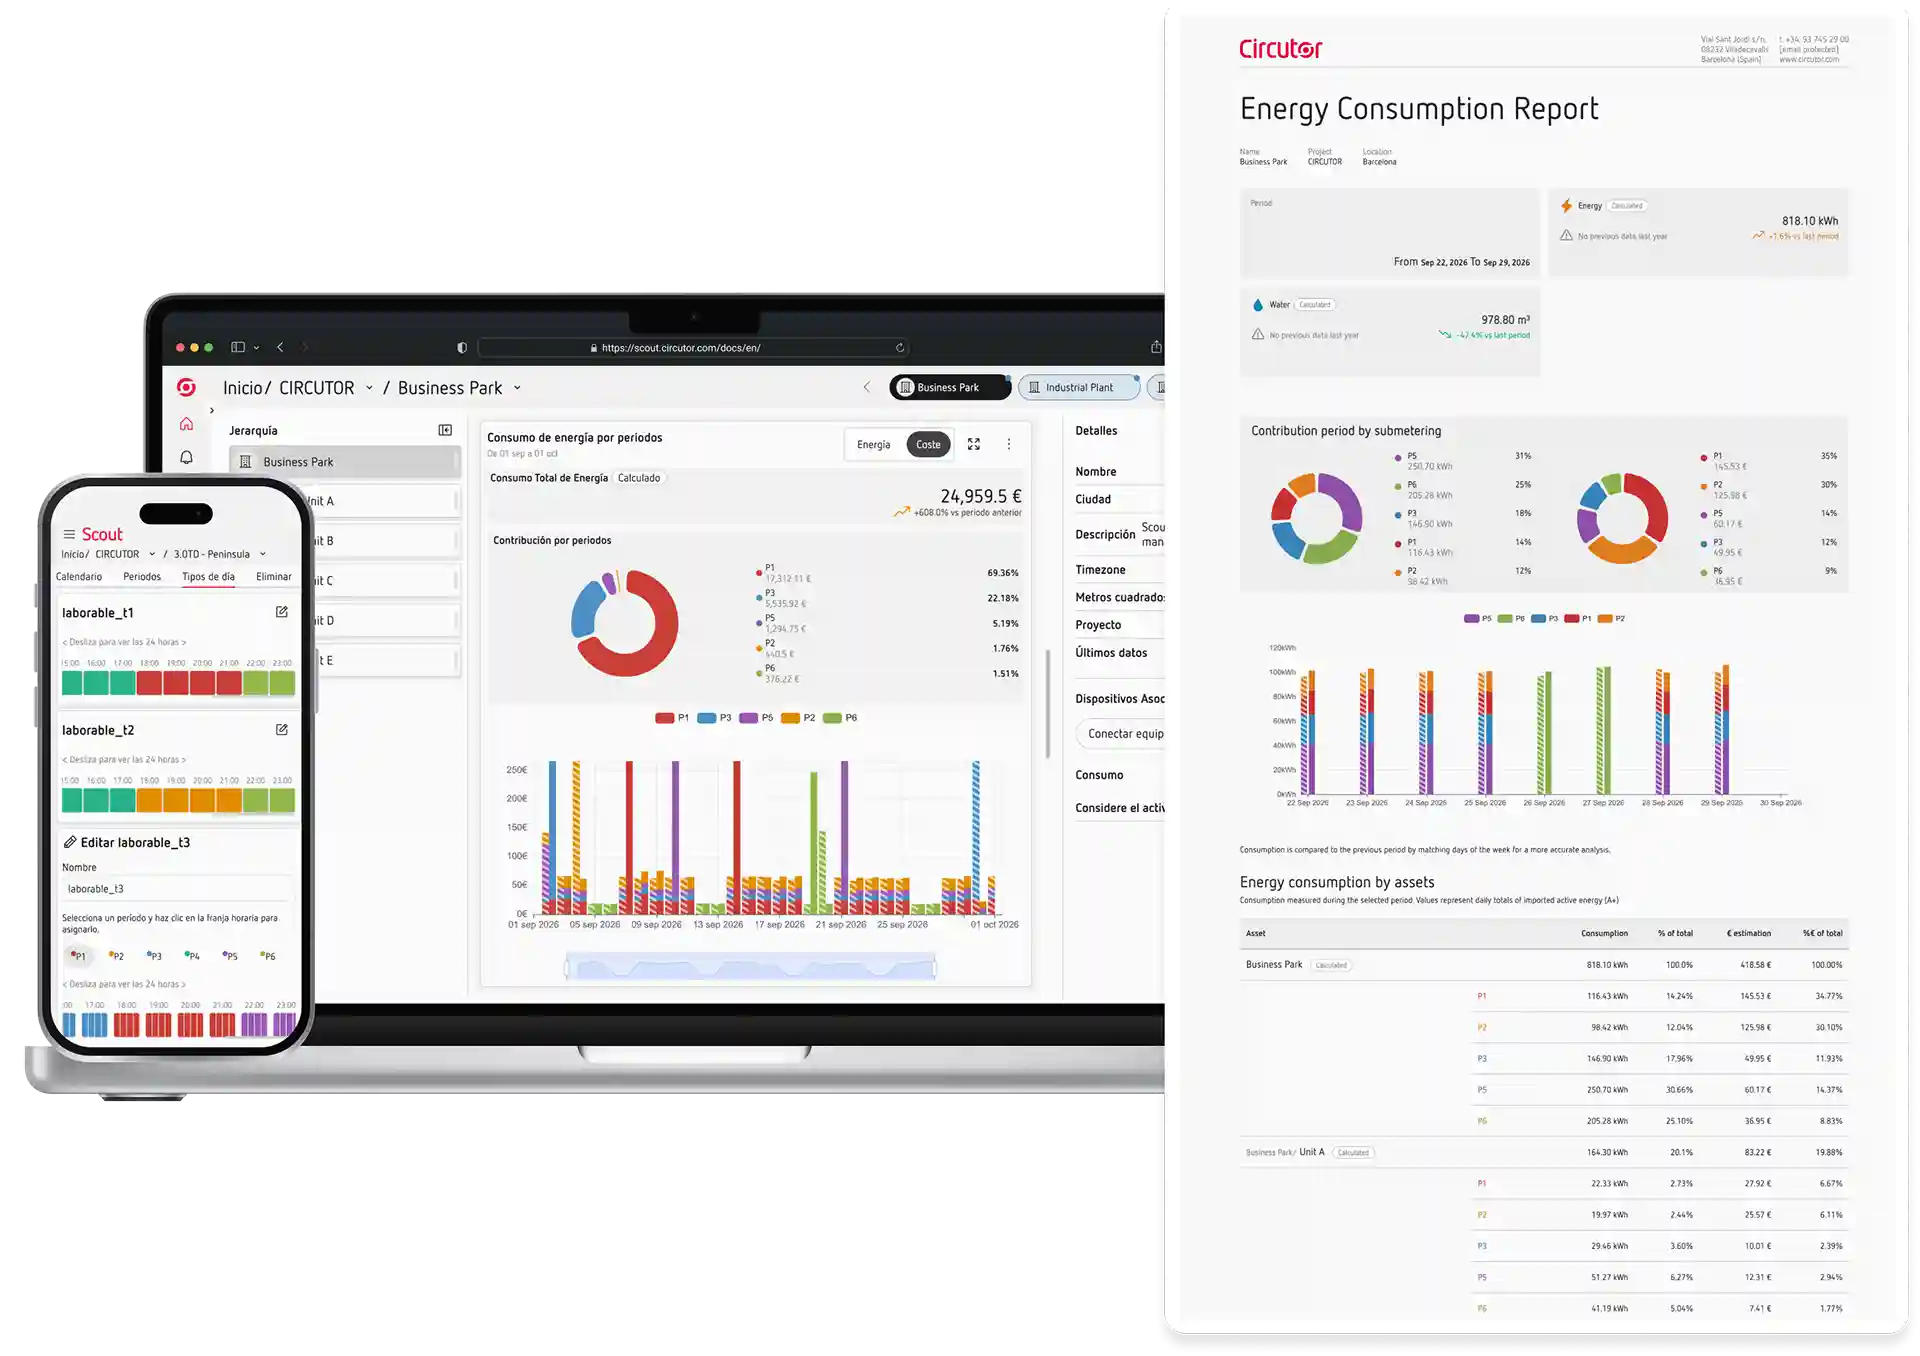
Scout brings together the installation’s consumption data to make it easier to monitor and analyze.
The Consumption by tariff period feature lets you see how energy is distributed across the different periods and, when the corresponding costs have been configured, consult the cost associated with each one.
This information makes it possible to identify the periods with the highest consumption or cost and investigate their causes by relating them to other installation data, such as assets or energy uses.
This way, Scout lets you move from an overall view of consumption to a more detailed analysis of when energy is consumed, where consumption is concentrated and what its economic impact is.
Having this information makes it easier to identify opportunities for improvement and helps you make decisions based on real installation data.

WRITTEN BY CIRCUTOR
Vial Sant Jordi s/n – 08232
Viladecavalls, Barcelona (Spain)
+34 93 745 29 00
Contact
After-Sales and Technical Assistance
+34 93 745 29 19
Send enquiry

© 2026 CIRCUTOR.COM | All rights reserved.