![]()
![]()
![]()
admin | 13 de June de 2019
Where does the problem lie then? |
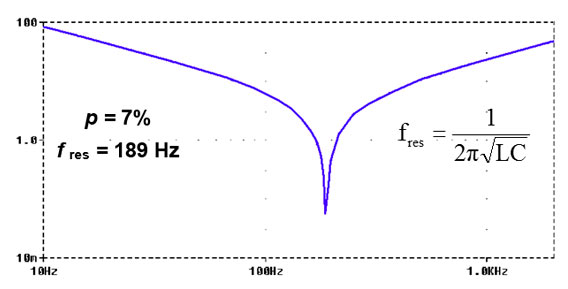 Fig. 1 - Frequency response of a detuned filter with p = 7 % (189 Hz)
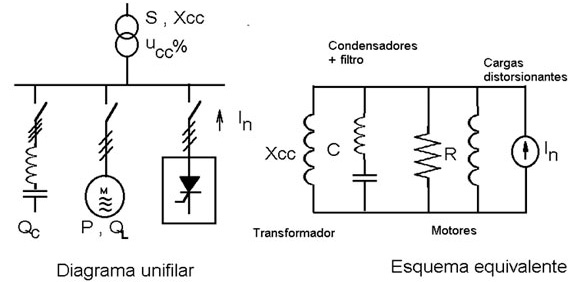
Fig. 2 - Single-line diagram and equivalent diagram of an installation fitted with a detuned filter
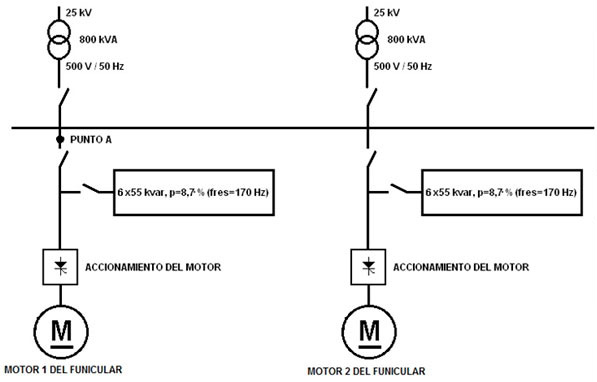 Fig. 3 - Simplified single-line diagram of the installation of a funicular railway in the city of Barcelona
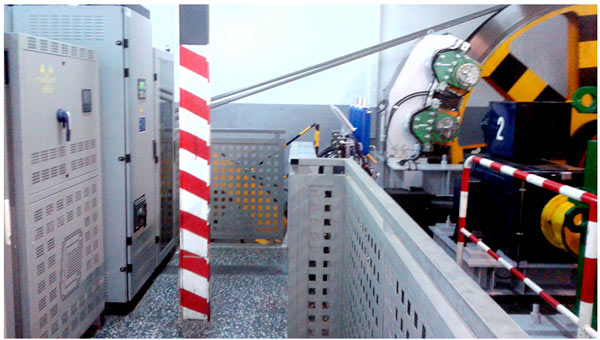 Fig. 4 - Installation of the funicular. The capacitor bank is shown on the left of the photo
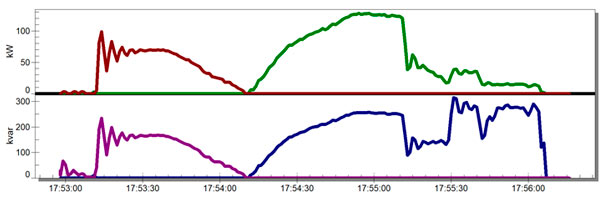 Fig. 5 - Evolution for the Active Three-Phase Generated Power (red), Active Three-Phase Consumed Power (green), and Inductive Reactive Consumed Power (purple and blue)
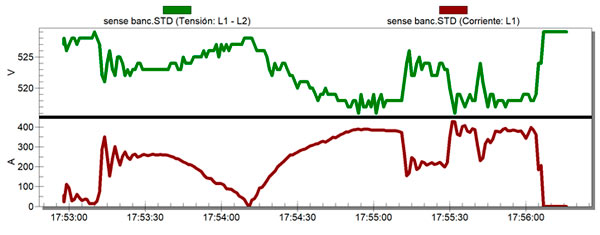 Fig. 6 - Evolution for Voltage between L1 and L2 phases (blue) and Current Intensity in L1 (green) at Point A
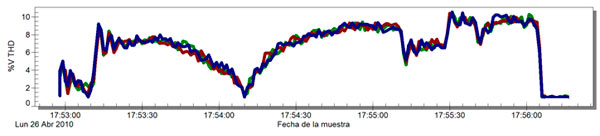 Fig. 7 - Voltage harmonic distortion evolution per phase at Point A
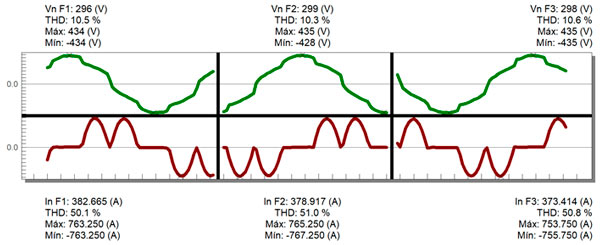 Fig. 8 - Voltage and current wave shapes at times of peak transducer consumption
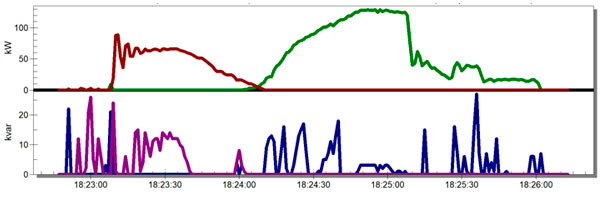 Fig. 9 - Evolution for the Active Three-Phase Generated Power (red), Active Three-Phase Consumed Power (green), and Inductive Reactive Consumed Power (purple and blue)
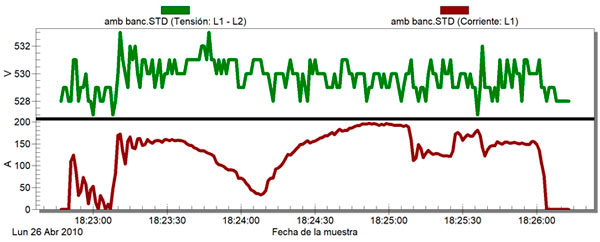 Fig. 10 - Evolution for Voltage between L1 and L2 phases (blue) and Current Intensity in L1 (green) at Point A
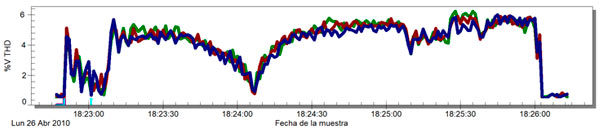 Fig. 11 - Voltage harmonic distortion evolution per phase at Point A
CIRCUTOR, your most reliable ally when requirements are related to power factor correction. |
WRITTEN BY CIRCUTOR
![]()
![]()
![]()
Vial Sant Jordi s/n – 08232
Viladecavalls, Barcelona (Spain)
+34 93 745 29 00
Contact
After-Sales and Technical Assistance
+34 93 745 29 19
Send enquiry
© 2024 CIRCUTOR.COM | All rights reserved.